
Wool is a protein fibre shorn from sheep, used across knitwear, suiting, outerwear, base layers and carpets. Merino is the finest and most widely specified type in apparel. The carbon footprint of wool averages 18.08 kg CO₂e per kg of fibre, roughly eight and a half times cotton and nearly four times polyester, which makes it one of the few material choices that moves a product footprint on its own. As finished knit fabric that becomes around 33.00 kg CO₂e per kg, and wool is unusual in that the fibre is still the majority of that total.
What are the CO₂e emissions of wool?
18.08 kg CO₂e per kg of wool fibre
Around 8.5 times global-average cotton
Around 3.8 times polyester
The figure covers cradle-to-gate production, i.e. sheep farming, shearing, and the scouring that removes grease and dirt from the raw fleece. It stops at fibre ready to spin.
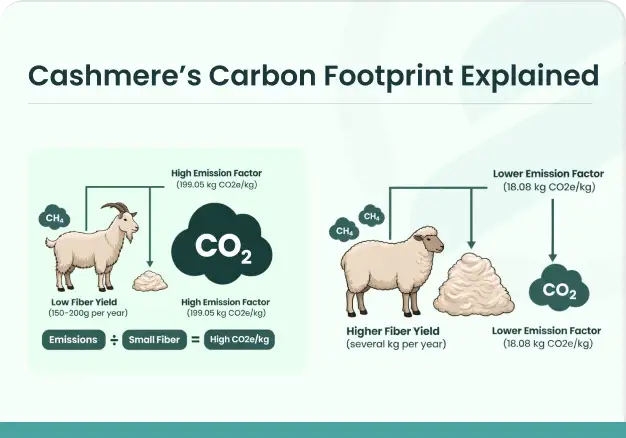
Wool’s footprint is driven by the animal rather than the processing. Sheep produce methane through digestion, and that enteric methane accounts for the large majority of the number. Scouring and transport are comparatively minor by the time they are added.
Is there a merino-specific figure?
No. Merino, lambswool, Shetland, crossbred and carpet wool all carry the same 18.08, because wool production is modelled generically rather than by breed.
That is common across life cycle assessment, since the collection burden for breed-level studies is high and most of the emissions come from the animal rather than the fibre type.
You can use 18.08 for merino, provided you describe it as a generic wool figure. What you cannot do is compare merino against another wool type and publish the result, because that comparison will return no difference by construction.
Origin works the same way. Australian, New Zealand and South American wool all carry one value, even though farming systems and grid intensity differ substantially between them.
Why two credible wool figures can disagree
Wool comes off a sheep that also produces meat, and how the farm’s emissions get divided between the two determines the wool figure.
Splitting by the energy the animal puts into each output gives one answer. Splitting by the revenue each generates gives another. Both approaches are defensible and they can produce wool figures that differ by a wide margin from identical farm data.
When a supplier’s wool number disagrees with yours, this is the first thing to check, ahead of geography or year.
Recycled wool
0.55 to 0.89 kg CO₂e per kg, depending on the mechanical route
A reduction of 95% to 97% against virgin wool
Two routes are costed separately, which is unusual and useful. Fraying at 0.55 pulls the fabric apart along its structure and produces a longer, more spinnable fibre with less mechanical work. Shredding at 0.89 breaks the fabric down more aggressively, using more energy and producing shorter fibre that usually needs blending with virgin to spin.
We arrive at these numbers by counting from the point waste enters the recycling process, so nothing upstream is included. The 63% gap between the two routes is a process difference, and most recycled wool suppliers will know which one they run.
Very few material substitutions in apparel are as large as this one.
Wool fabric carbon footprint
Knit fabric: 33.00 kg CO₂e per kg Woven fabric: 36.65 kg CO₂e per kg
| Stage | kg CO₂e per kg |
|---|---|
| Wool fibre | 18.08 |
| Ring-spun yarn | 2.41 |
| Circular knitting | 6.97 |
| Scouring and bleaching | 0.30 |
| Acid dyeing | 5.11 |
| Finishing | 0.13 |
| Knit fabric | 33.00 |
Fibre is 55% of the finished knit fabric total. Wool is one of the few fibres where the material still dominates after processing, so material substitution stays the most effective lever rather than being overtaken by the mill stages.
Woven fabric comes to 36.65, because weaving costs 10.18 kg CO₂e per kg against 6.97 for circular knitting.
We calculate these totals on this construction: ring-spun yarn, batch dyeing and a light finish. A different spinning system, dye class or finishing route will change the number.
How does wool compare to other fibres?
| Fibre | kg CO₂e per kg |
|---|---|
| Recycled wool | 0.55 |
| Cotton, global average | 2.13 |
| Polyester | 4.78 |
| Wool | 18.08 |
| Silk | 117.97 |
| Cashmere | 199.05 |
Wool water use
Wool uses 0.60 m³ of water per kg of fibre, below global-average cotton at 0.75 and far below cotton grown in India at 15.2.
What wool means for a product footprint
A 400 gram wool sweater:
| Fibre choice | Fibre-stage emissions |
|---|---|
| Recycled wool, fraying route | 0.22 kg CO₂e |
| 50% recycled, 50% virgin | 3.73 kg CO₂e |
| Virgin wool | 7.23 kg CO₂e |
A half-and-half blend halves the fibre footprint while keeping enough virgin content for spinnability, which is why blends rather than 100% recycled tend to be the workable commercial position.
Those are fibre-stage figures. At fabric level the same sweater carries around 13.20 kg CO₂e before it is cut and made up, on the knit build above.
What these figures cover
Two boundaries on this page. The fibre figures cover farming through to scoured fibre. The fabric figures add spinning, knitting or weaving, preparation, dyeing and finishing on one stated construction. Garment making, transport, use and end of life sit outside both.
Industry averages. These figures support an estimate of your wool footprint. They cannot support a claim that your grower outperforms the sector.
No breed or origin split. As above. Merino takes the generic figure.
How emissions are split between wool and meat is set by the underlying assessment, not chosen here. Worth stating which basis you are working on when you report.
Carbon and water only. Mulesing, land use and biodiversity are not represented, and those are the questions that dominate wool sourcing conversations.