
Linen is a natural fibre spun from the stalk of the flax plant. It appears across apparel in shirting, summer tailoring, dresses and trousers, and it carries a large share of the home textiles market in bedding and upholstery. The carbon footprint of linen fibre is 1.03 kg CO₂e per kg, while the footprint of linen fabric is 13.20 kg CO₂e per kg for knit fabric and 16.85 kg CO₂e per kg for woven fabric.
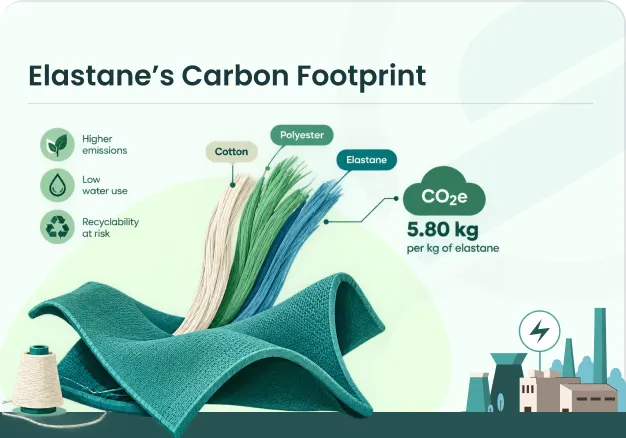
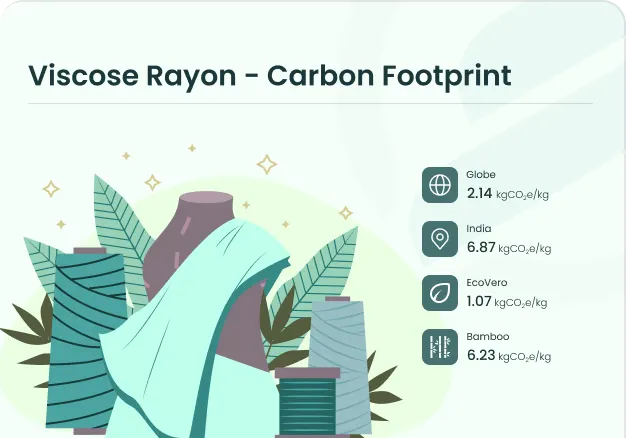
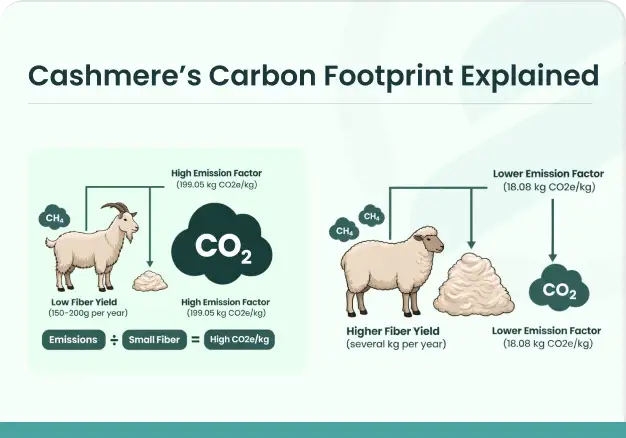
At the raw fibre stage, linen performs well against several commonly used fibres. Global-average cotton has a footprint of 2.13 kg CO₂e per kg, viscose 2.14 kg, polyester 4.78 kg, and wool 18.08 kg. Linen fibre comes in at 1.03 kg CO₂e per kg.
Once that fibre becomes fabric, however, the emissions from spinning, knitting or weaving, preparation, dyeing and finishing become much more significant. The 1.03 kg CO₂e associated with the fibre accounts for less than 8% of the footprint of linen knit fabric.
So, is linen fabric low-carbon?
What is the carbon footprint of linen fabric?
For a modelled linen textile, the footprint is:
- Linen fibre: 1.03 kg CO₂e/kg
- Ring-spun yarn: 2.41 kg CO₂e/kg
- Circular knitted fabric: 6.97 kg CO₂e/kg
- Scouring and bleaching: 0.30 kg CO₂e/kg
- Vat dyeing: 2.36 kg CO₂e/kg
- Finishing: 0.13 kg CO₂e/kg
- Total knit fabric: 13.20 kg CO₂e/kg
For woven linen, the modelled footprint is 16.85 kg CO₂e per kg of fabric, with weaving contributing more emissions than circular knitting in the construction used above.
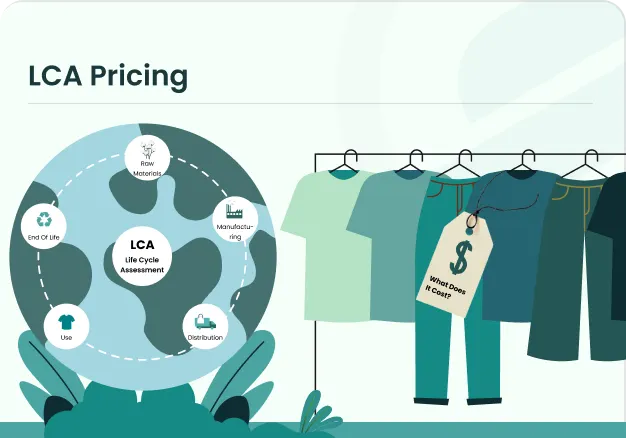
These figures represent a cradle-to-gate estimate. They cover flax cultivation and fibre processing, followed by the textile processes included in the stated fabric construction. Garment manufacturing, transport, consumer use and end of life are not included.
Why does linen have a relatively low fibre footprint?
Linen is made from the stalk of the flax plant. Flax is predominantly rain-fed in its main European growing regions and requires less fertilizer than cotton. Once harvested, the stalk is processed through mechanical steps such as retting, scutching and hackling to separate the fibre.
This gives linen a comparatively low footprint at the raw-material stage.
Is linen more sustainable than cotton?
At the fibre stage, linen has a lower carbon footprint than global-average cotton: 1.03 kg CO₂e per kg for linen compared with 2.13 kg CO₂e for cotton and with 9.55 kg CO₂e per kg for Indian cotton.
However, this does not mean that every linen fabric or linen garment will have half, or one-ninth, the carbon footprint of a cotton product. Fabric construction, yarn production, dyeing, finishing, manufacturing and other stages change the result.
So, meaningful comparison can be made between equivalent products made from different materials, using the same system boundary and production assumptions.
What is the carbon footprint of a linen shirt?
For a shirt using 220 grams of linen fibre, the fibre-stage emissions are approximately 0.23 kg CO₂e.
Using the modelled woven linen fabric figure of 16.85 kg CO₂e per kg, the fabric stage would correspond to approximately 3.71 kg CO₂e for 220 grams of fabric.
Is linen better for the climate than other fibres?
Linen has a relatively low carbon footprint at the fibre stage compared with several widely used fibres:
| Fibre | kg CO₂e per kg |
| Recycled linen | 0.60 |
| Linen | 1.03 |
| Cotton, global average | 2.13 |
| Viscose | 2.14 |
| Polyester | 4.78 |
| Cotton, grown in India | 9.55 |
| Wool | 18.08 |
Does linen use less water than cotton?
Linen uses 0.50 m³ of water per kg of fibre, compared with 0.75 m³ per kg for global-average cotton.
Linen’s water advantage comes from flax being predominantly rain-fed in its main growing regions.
Water use and carbon emissions measure different environmental impacts, so a lower water footprint does not automatically mean a lower overall environmental impact.