Unlocking the Power of Carbon Accounting: A Path to Compliance and Cost Savings
Companies are increasingly adopting clean and green measures to meet the now-mandated global non-financial sustainability disclosure requirements. Beyond assessing their assets and liabilities, these companies are also taking responsibility for the environmental impact of their operations. By incorporating the latest green technologies into their manufacturing processes and setting short-, mid-, and long-term goals to reduce carbon intensity, they are actively working to mitigate their ecological footprint.
However, these efforts are only effective when companies can accurately quantify their emissions—a task accomplished through carbon accounting.
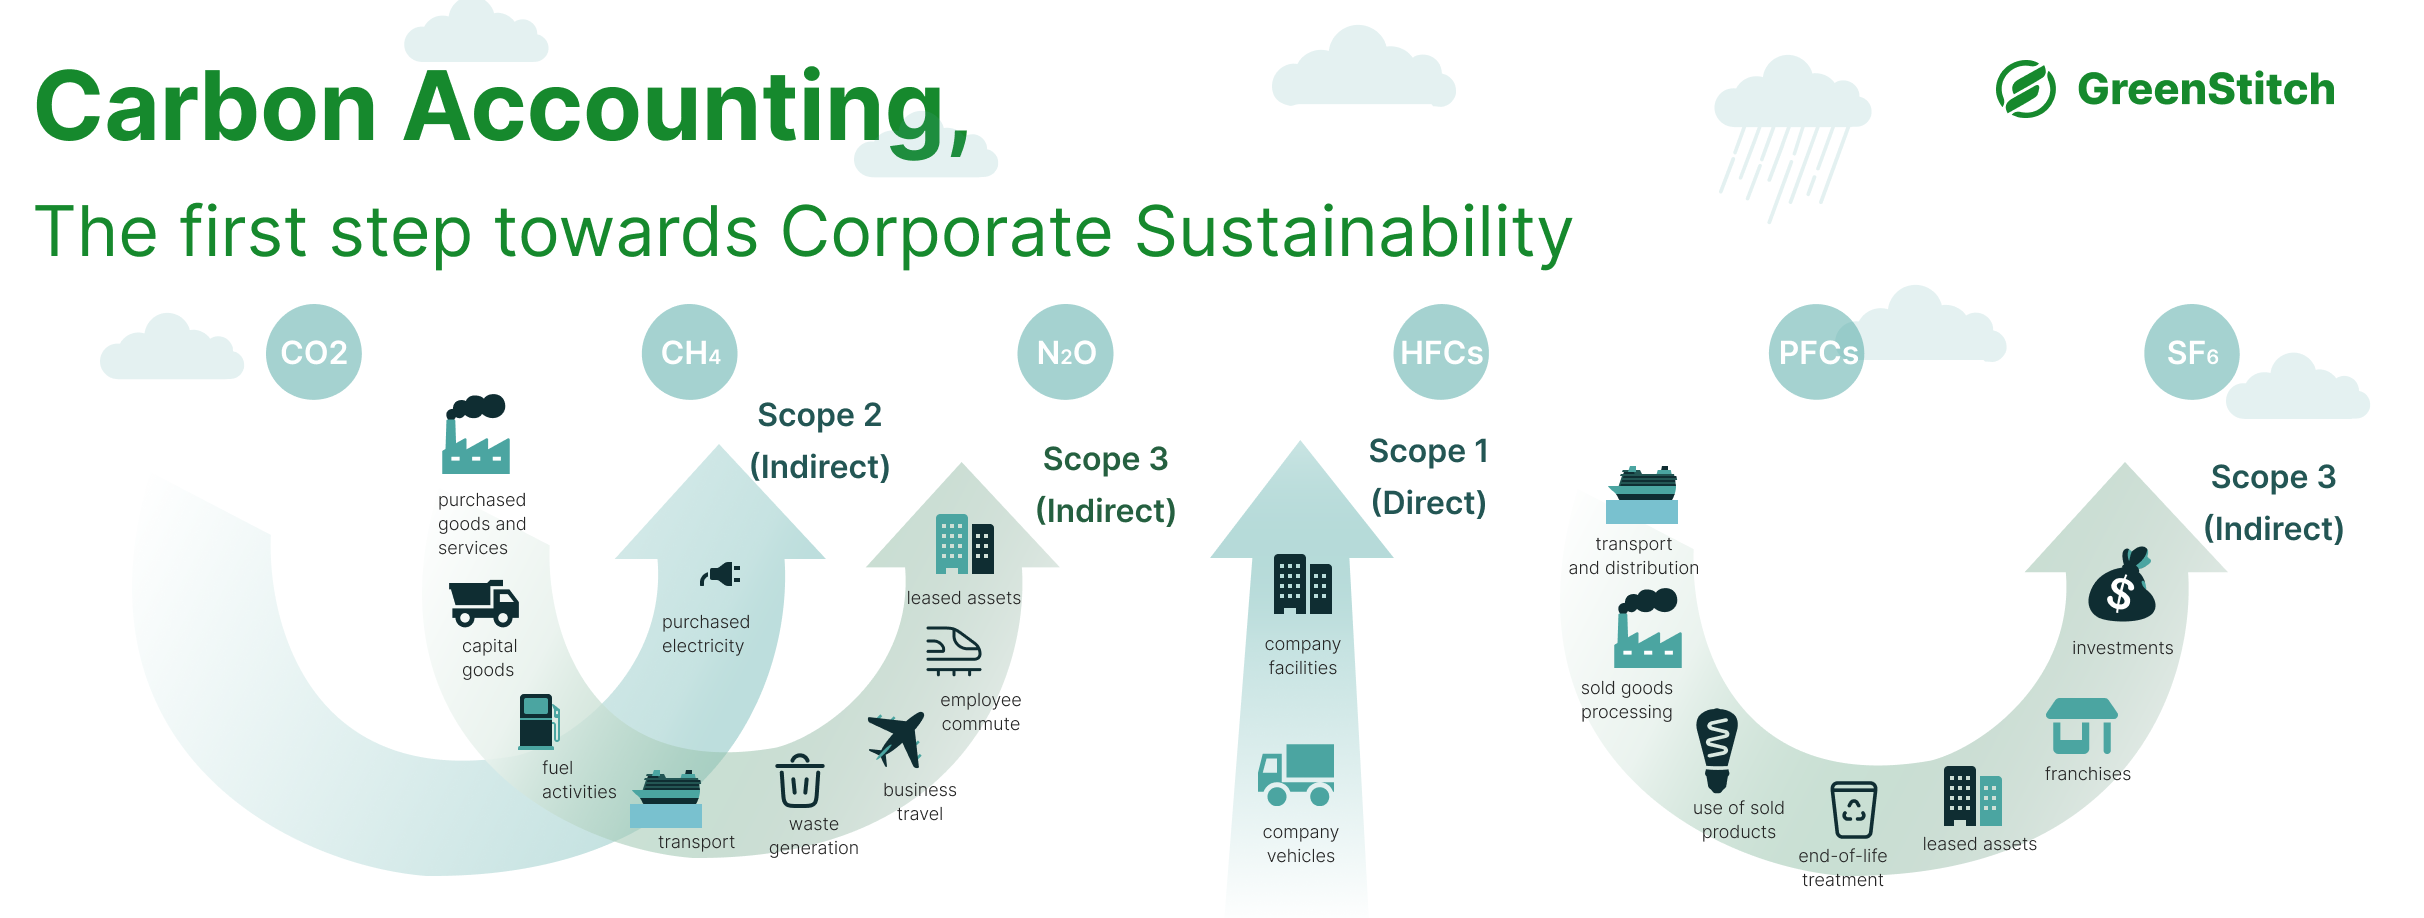
Carbon accounting is a process that enables companies to track and measure the greenhouse gas (GHG) emissions generated by their operations. This provides a clear picture of an organization’s “carbon footprint”. In the textile industry, this involves calculating emissions of various gases, such as carbon dioxide (CO2), methane (CH4), nitrous oxide (N2O), and fluorinated gases, which are produced during processes like spinning, weaving, and dyeing. The amount of these gases released depends on several factors, including product size, raw materials used, production location, the country's electricity mix, factory operations and energy mix, and the technology employed.
You can’t manage what you can’t measure. Organisations increasingly adopt carbon accounting to manage their overall carbon emissions. It is not only essential for minimizing climate risk and mitigating regulatory risks, but also enhances the company’s broader reputation, climate-proof the supply chains, and results in cost savings to the company. Increased mandatory disclosure requirements under new regulations such as CSRD, and BRSR and voluntary disclosures such as CDP, require companies to measure the carbon emissions resulting from their operations and ensure regulators in different countries that they are on the path of sustainability by placing on record the measures the company is taking to mitigate climate risk. Staying compliant with such measures improves the company’s goodwill and these disclosures become a tool kit for potential sustainable investors to make an investment decision and companies can attract funds.
Many research studies have shown that sustainable operations result in cost savings of crores for companies. By carrying out carbon accounting, companies can identify carbon hotspots. This exercise is in tandem with new aggressive tax legislation, such as the Carbon border adjustment tax (CBAM), with which Europe is planning to phase out the polluting suppliers of other countries from its supply chains. Carbon accounting can help such suppliers by targeting the hotspots with effective decarbonisation strategies.
Carbon accounting can be performed by using various methods such as spend-based and activity-based. The spend-based method calculates GHG emissions by multiplying the financial value of a purchased good or service with its emission factor hence arriving at the amount of emissions produced per financial unit. However, this method lacks specificity since it uses an industrial average of GHG emissions.
The other method is activity-based, which takes into granular data such as the amount of fuel, kilograms of textile, and amount of electricity used and uses the emissions factor (which are based on scientific models) of each of these activities to arrive at total emissions produced by the product. It is more accurate than the spend-based and carbon accounting generally use this method to arrive at more accurate emissions. However, the emission factor varies at different locations. For example, cotton manufactured in India produces higher emissions than cotton manufactured in the UK. Similarly, such emissions also vary at the factory level in the same geography. If a manufacturer in a country is using an electricity mix having a higher portion from a renewable energy supplier then its production process would result in fewer emissions than the manufacturer deriving its electricity from a fossil fuel-based supplier. This is illustrated in the example below:
Let's explore this with an example. Hypothetically, consider six manufacturers operating in India and Vietnam—three in each country—using different electricity mixes and raw materials to produce 1,000 cotton T-shirts. Assume that an Indian manufacturer uses conventional cotton, resulting in a carbon intensity of 2.4 kg of emissions per 1 kg of T-shirt, while a Vietnamese manufacturer uses organic cotton, with a carbon intensity of 1.1 kg of emissions per 1 kg of T-shirt.
Given the different carbon intensities of production processes in India and Vietnam, it's calculated that approximately 5.2 kg of carbon emissions are associated with purchased goods in India, while 3.9 kg of emissions are linked to the same in Vietnam. The following table illustrates how the carbon emissions of a supplier would differ if they used renewable sources of electricity and organic cotton:
S. No
Supplier
1
2
3
4
5
6
A
Country of operations
India
India
India
Vietnam
Vietnam
Vietnam
B
Electricity mix
100% Grid Electricity
100% Renewable
50% Grid 50% Renewables
100% Grid Electricity
100% Renewable
50% Grid 50% Renewables
C
Type of Raw Material (Cotton) Used
Conventional Coton
Conventional Coton
Conventional Coton
Organic Cotton
Organic Cotton
Organic Cotton
D
Size of T-shirt Batch
1000
1000
1000
1000
1000
1000
E
Size of Batch in Kg
303.0
303.0
303.0
303.0
303.0
303.0
Emissions from Raw Material Used
1
Carbon intensity of Cotton (per kg)
2.4
2.4
2.4
1.1
1.1
1.1
2
Total carbon emissions of supplier from cotton used (in kg)
727.3
727.3
727.3
333.3
333.3
333.3
Electricity Mix
3
Electricity used in producing 1 kg T-shirt (Kwh)
5.3
5.3
5.3
5.3
5.3
5.3
4
Grid Emission Factor (gCO2/KWh) for producing these T-shirts
713
0
356.5
475
0
237.5
5
Total Electricity emissions of supplier for producing 1000 T-shirts (in kg)
3778.9
0
1889.45
2517.5
0
1258.75
Carbon emissions from purchased goods
6
Emissions come from purchased goods (in kg)
5200
5200
5200
3900
3900
3900
Total Emissions
7
Total emissions for supplier (2+5+6)
9706.2
5927.3
7816.7
6750.8
4233.3
5492.1
Renewables and sustainable raw materials can significantly lower your “carbon footprint” It has been found that suppliers can significantly reduce their emissions by transitioning to cleaner energy sources. For instance, a supplier in India can cut its carbon emissions by 39% by fully shifting to renewable electricity, and by 19.4% if it transitions 50% of its electricity needs to renewables. Similarly, a Vietnamese supplier can reduce its carbon emissions by 37% by completely switching to renewable energy, and by 19% if it shifts 50% of its electricity requirement to renewables. Similarly, if Indian manufacturers start using sustainable raw materials, they can reduce their overall carbon emissions.
However, calculations of these carbon emissions are very complex when the complexity of the textile supply chain is taken into account. A significant portion of GHG emissions in a company’s operations comes from indirect sources, with over 95% attributed to factors beyond the organization’s direct control. Thus, it is important to understand the different scopes of emissions for textile organisations as defined by the GHG Protocol to analyse the emissions which are in direct control of the organisation and how collaborations with suppliers moving towards green goals can reduce their indirect emissions significantly.
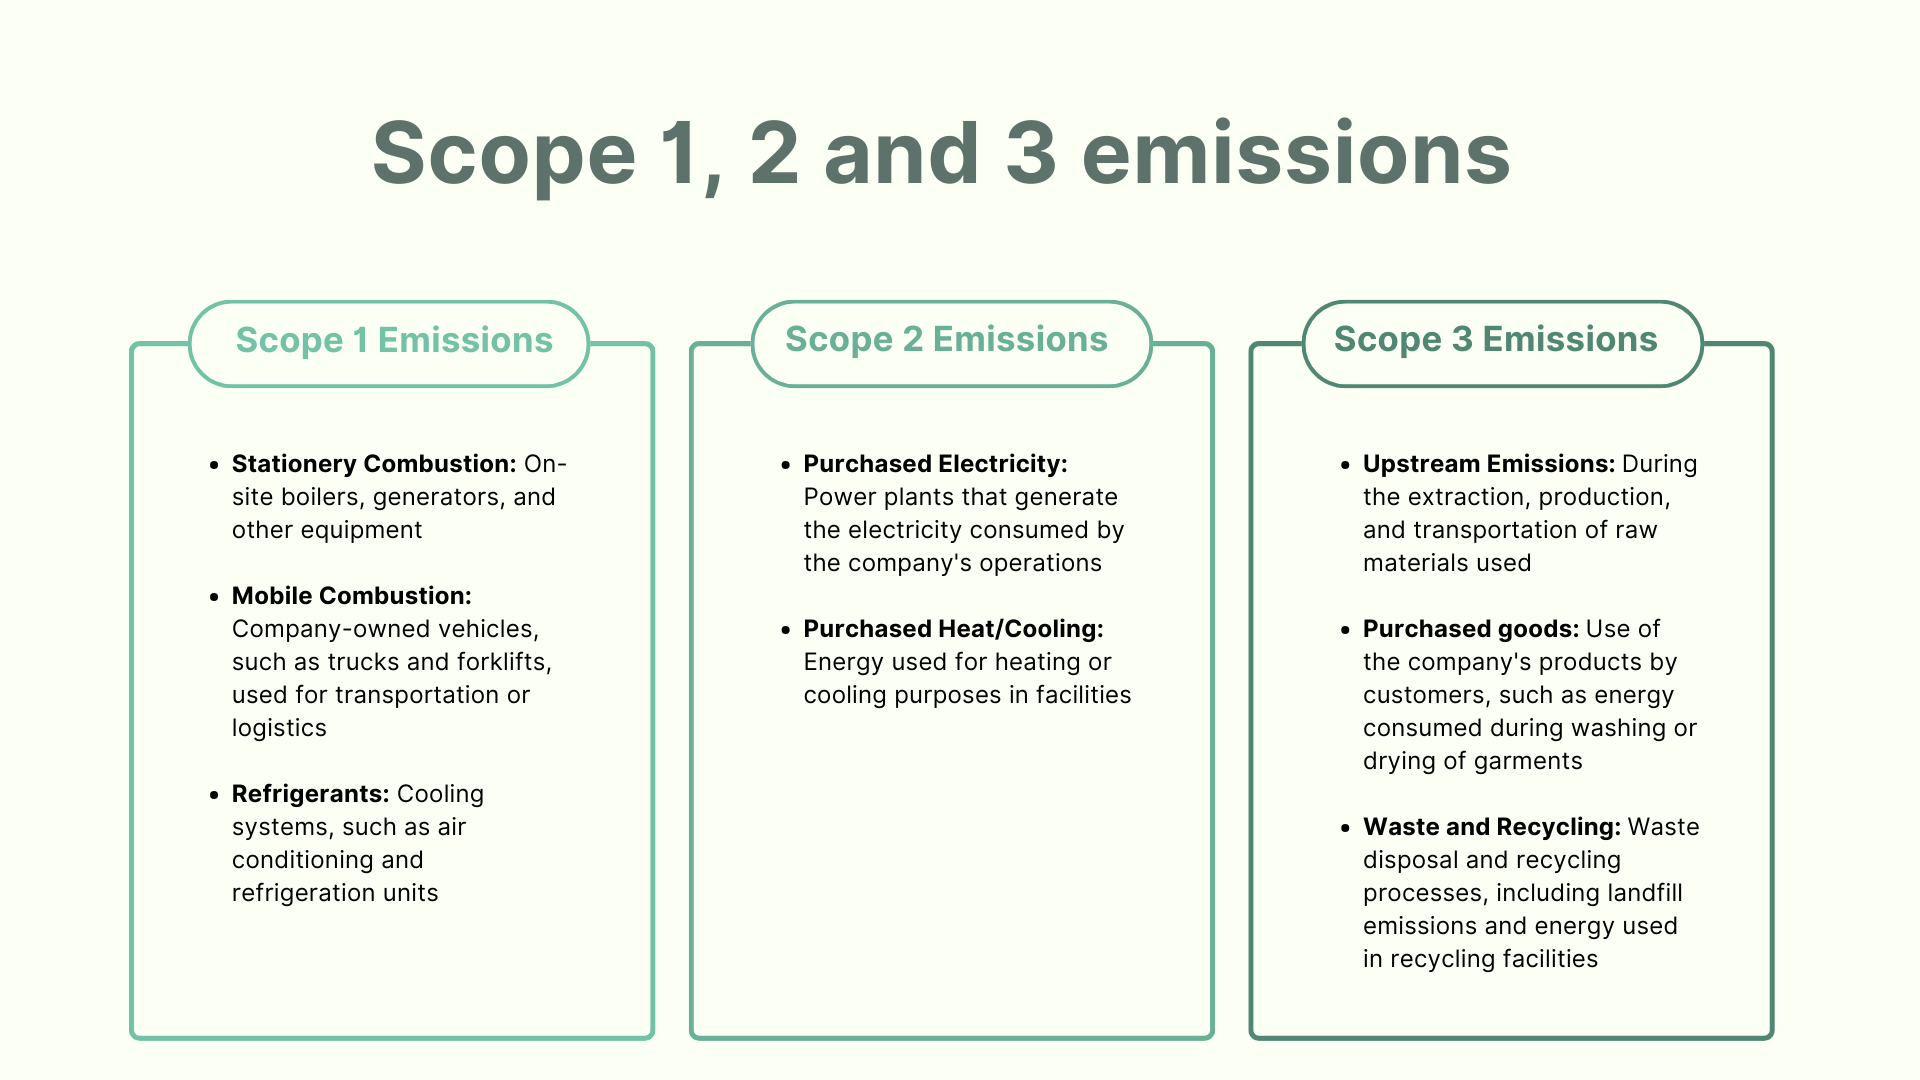
Decoding “Scope 1, 2 and 3 emissions”
As per GHG protocol standards, Scope 1 emissions in a textile organisation are the direct GHG emissions that occur from sources that are owned or controlled by the company. For example, emissions from fuel combustion in owned or controlled boilers, furnaces, vehicles, etc., and emissions from chemical production in owned or controlled process equipment.
Scope 2 emissions in the textile sector are the indirect emissions that majorly result from electricity consumption, heating, cooling, and steam. These emissions are considered indirect because the company doesn't directly burn the fuels that generate the energy, but instead buys it from a third party, like a utility company. The prominent sources of indirect emissions within the industry were those resulting from dyeing, printing, cutting, wadding plants, quilting, stitching, and quality control processes requiring electricity and natural gas input.
Scope 3 emissions in the textile sector result from activities that a company neither owns nor directly controls but they occur in its value chain. These occur due to the company’s upstream and downstream activities such as business travels, waste disposal, transport of grey (raw material) to the industry, delivery of goods to the party/customers, systems for inventory control, etc.
By aggregating all emissions, companies can gain a comprehensive understanding of their “carbon footprint”, which is crucial for developing effective decarbonization strategies.
Challenges to Carbon Accounting
Carbon accounting is complex, requiring accurate, real-time, and historical energy data. Manual data collection and spreadsheet use can lead to errors, inefficiencies, and challenges in meeting multiple reporting standards. Key difficulties include data fragmentation, compliance with various frameworks, lack of real-time data, and scalability issues. Below are the key challenges faced by organisations:
Data shortfalls - quality and quantity issues Carbon accounting requires data for different categories under “scope 1, 2 and 3 emissions”. It is difficult for a company to have such granular details on each organisation activity. Thus, the initial challenge is collating the data on various processes such as ginning, spinning, dyeing, transportation, electricity, fuel consumption, etc., and establishing a mechanism to update the required data points regularly. Further, the data is collected in silos on various metrics such as waste, energy, water, land use spread across various spreadsheets. Thus, it becomes difficult to consolidate them for decision-making.
Barriers to scope 3 data collection: A report has observed that only 20% of EU-based companies have supply chain “carbon emission data”, that is “tracking scope 3 emissions” capable of meeting financial audit quality requirements by 2024. Collecting Scope 3 data points require cordial relations with supply chain partners involving coordination with a lot of stakeholders and win their trust to access their crucial data.
Complexities of calculations: Carbon accounting involves complex calculations where various emission factors are taken into account when accurate and reliable data is unavailable. Companies, especially MSMEs are not equipped with scientific models and databases available with a carbon accounting firm such as Ecoinvent, whose data points can be used in case of the absence of data points with the organisation.
Managing compliance in a dynamic regulatory environment: Regulators, globally have become stringent in non-financial sustainability reporting shifting from voluntary to the mandatory regime of disclosure requirements. CSRD, BRSR reporting, CDP disclosures, and GRI are some of the regulations which are been accepted by different regulators in different nations. However, it would be difficult for companies in different geographies to comply with these regulations simultaneously. Thus, here carbon accounting and ESG reporting software such as Greenstitch comes to the rescue.
Limited resources and expertise: A recent assessment reveals that only one-third of corporate boards have expertise in sustainability, while over half acknowledge a limited understanding of sustainability-related regulations. This knowledge gap often pushes sustainability to the margins of core business strategies and can lead to misguided investments aimed more at appearance than substance.
Selecting the right software: Many organizations, including Sphera and PRé Sustainability, have developed automated “sustainability platforms”. Yet, these legacy software solutions often adopt a one-size-fits-all approach across different industries, which is not ideal for handling complex calculations. Additionally, some of these platforms are incompatible with the latest operating systems, such as macOS, and common applications like Excel, disrupting smooth day-to-day operations.
Automated systems and integrated platforms are needed to improve accuracy, efficiency, and alignment with international standards, helping organizations track performance and meet sustainability goals. Greenstitch addresses these challenges by offering a “sustainability platform” specifically designed for the textile and fashion industry. It is user-friendly and tailored to meet industry-specific needs, ensuring compatibility with daily-use applications like Microsoft Office and various operating systems. The intuitive design of this software allows businesses to operate the platform independently with minimal external support.
Greenstitch’s Carbon Accounting Software
Greenstitch is an AI-powered “sustainability platform” offering comprehensive solutions for carbon accounting, life cycle analysis, supply chain decarbonization, traceability, and ESG reporting. As a ‘one-stop-shop’, it enables businesses to operate efficiently with minimal human support from Greenstitch. The initial data entry into the software takes just two weeks, after which it seamlessly facilitates the organization’s carbon accounting processes. The platform offers the following features:
Industry-specific platform: Greenstitch is specially designed for textile, clothing, and fashion companies enabling them to calculate, validate, and communicate the environmental impact of textile materials and products. It provides solutions to textile problems by incorporating primary textile databases such as existing ERPs & inventory databases, such as Ecoinvent, and Base Empriente which leads to filling in data gaps and results in smooth analysis.
Activity-based method for calculations: The software takes granular data of each activity including the amount of electricity used, fuel consumed, materials used, textile formation methods, and waste percentage, and calculates emissions based on the same. For instance, it helps quantify the amount CO2 released during transportation (kg CO2-eq per km), using electricity (kg CO2-eq per kWh), or manufacturing clothes (kg CO2-eq per kg of textile).
Automation in data entry: Greenstitch has automated the data collection and “Scope 1, 2 and 3 emissions” calculation at each stage of the life of a product. The process of entering data into the software takes two weeks and then it is ready to use. Moreover, the software can integrate previous sustainability reports and datasets of the company making it easier for future analysis and providing 10x faster results with audit-grade accuracy.
Identify ‘carbon hotspots’ in the supply chain: Carbon accounting with Greenstitch helps in identifying “supply chain environmental impact” areas, that are, hotspots having the highest “carbon footprint” in the textile value chain, and suggests tailored solutions to reduce the same. It helps in finding low-carbon suppliers, cost-savings in the supply chain, and monetary opportunities in terms of sustainable finance in reducing emissions towards net zero.
Aligned with global frameworks, standards, and regulations: GreenStitch follows globally recognized standards and frameworks such as the GHG Protocol, SBTi, TFCS, UNFCCC, GRI, and PEF protocol. It also helps in downloading reports compatible with various regulations such as BRSR, CSDDD, CSRD, Higg, and CDP reporting in one place. With the passing of new regulations such as CBAM, it has become pertinent for companies to adopt carbon accounting in practice to know the carbon intensiveness of their products.
Greenstitch has aimed to provide a straightforward, user-friendly solution for textile and fashion companies by implementing smart automation and artificial intelligence that work seamlessly with universal operating systems. This approach helps companies better understand their "supply chain environmental impact" and move towards sustainability.
References:
- Akhtar, Sana & Baig, S.F. & Saif, S. & Mahmood, A. & Ahmad, Sajid. (2017). Five year carbon footprint of a textile industry: A podium to incorporate sustainability. 16. 125-132. https://www.neptjournal.com/upload-images/NL-59-18-(16)D-495.pdf